The closing yield curves(hereinafter referred to as the closing curves)comprise treasury bond, central bank bill, policy bank bond, medium-term/short-term note(all credit ratings), corporate bonds(all credit ratings), NCD(all credit ratings), financial bond of commercial bank (all credit ratings), secondary capital bond of commercial banks (all credit ratings), ABS (all credit ratings), commercial paper of securities company(all credit ratings), and PPN(all credit ratings). Each type of bond has a yield to maturity curve, a spot rate curve and a forward rate curve. Intraday closing curves are published on the Chinamoney Website at 17:15 on every workday.
Treasury bond, central bank bill, policy bank bond, medium-term/short-term note(all credit ratings), corporate bonds(all credit ratings), NCD(all credit ratings), financial bond of commercial bank (all credit ratings), secondary capital bond of commercial banks (all credit ratings), ABS (all credit ratings), commercial paper of securities company(all credit ratings) yield curves, and PPN(all credit ratings) are option free, non-floating rate bonds (fixed rate bond, discount bond and zero coupon bond) traded in the interbank market. Specially, corporate bonds (AAA, AA+, AA, AA-) refer to secured ones and corporate bonds (AAA2, AA+2, AA2, AA-2) refer to unsecured ones. The sample bonds for policy financial bond, medium-term note and corporate bond (1Y_Depo or Shibor3M) spread yield curves are option-free and floating rate bonds traded in the interbank market.
Closing curves take daily bilateral quotation and deal data of corresponding sample bonds as samples. The closing yield to maturity curve is derived by performing calculations using a linear regression model, and the corresponding spot rate curve and forward rate curve are deduced from the closing yield to maturity curve.
The curve construction method is introduced by taking the closing curve for treasury bonds as an example:
I. The key rate durations for treasury bonds are set as 6M, 1Y, 2Y, 3Y, 5Y, 7Y, 10Y, 15Y, 20Y and 30Y.
II. Bilateral quotation data and trading data for all non-floating rate treasury bonds and option-free treasury bonds before market closing are collected.
III. For every treasury bond, the latest quoting price for the treasury bond of each market-making institution before closing is extracted and unreasonable market-making price data are ignored.
| Name of Bond | Pricing Institution | Latest Bid(%) | Latest Ask(%) | Remaining Maturity (Year) |
| 09 Discount Treasury Bond 02 | Institution A |
1.2299 | 1.1401 | 0.0658 |
| 09 Interest-Bearing Treasury Bond 21 | Institution B
|
1.3122 | 1.3100 | 0.6932 |
| … | … | … | … | … |
| 08 Treasury Bond 06 | Institution C | 4.2298 | 4.1297 | 28.3863 |
IV. The pricing data are sorted according to the length of the remaining maturity, the best bid rate and the best ask rate for every bond are extracted, and a list of remaining maturities and bid/ask rates are obtained.
|
Remaining Maturity (Years) |
Bid (%) |
Ask (%) |
|
1.3205 |
1.6100 |
1.6050 |
|
1.4329 |
1.6200 |
1.6100 |
|
1.5699 |
1.6050 |
1.5950 |
|
1.9370 |
1.6800 |
1.6500 |
|
2.9370 |
2.4000 |
2.3500 |
V. The bid rates and ask rates for key rate durations such as 6M, 1Y, 2Y, 3Y, 5Y, 7Y, 10Y, 15Y, 20Y and 30Y are calculated using the linear regression method, and the average value of the bid rate and the ask rate is the mean rate. The closing bid and ask yield curves are obtained by connecting the bid rates and ask rates corresponding to key rate durations.
|
Key Rate Durations (Years) |
Bid (%) |
Ask (%) |
Mean Rate (%) |
|
0.5 |
1.365 |
1.3161 |
1.3406 |
|
1 |
1.4981 |
1.4712 |
1.4846 |
|
2 |
1.9428 |
1.9185 |
1.9306 |
|
3 |
2.477 |
2.4379 |
2.4575 |
|
5 |
3.0097 |
2.9745 |
2.9921 |
|
7 |
3.2998 |
3.2638 |
3.2818 |
|
10 |
3.6647 |
3.6207 |
3.6427 |
|
15 |
4.1166 |
4.027 |
4.0718 |
|
20 |
4.1589 |
4.0654 |
4.1121 |
|
30 |
4.2434 |
4.1421 |
4.1928 |
VI. Trading data that differ substantially from the bid yield curve and the ask yield curve are discarded.
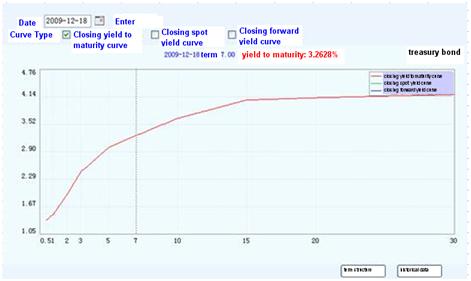
VII. The abovementioned prices and transaction samples are gathered and the yields to maturity for key rate durations such as 6M, 1Y, 2Y, 3Y, 5Y, 7Y, 10Y, 15Y, 20Y and 30Y are calculated using the linear regression method.
|
Key Rate Durations (Years) |
Yield to Maturity (%) |
|
0.5 |
1.3633 |
|
1 |
1.4860 |
|
2 |
1.9464 |
|
3 |
2.4511 |
|
5 |
2.9906 |
|
7 |
3.2628 |
|
10 |
3.6506 |
|
15 |
4.0636 |
|
20 |
4.1121 |
|
30 |
4.1928 |
The closing yield to maturity curve for a treasury bond is obtained by connecting the yields corresponding to key rate durations.